|
|
|
 |

|
|
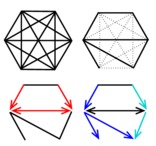
Robust reconstruction of causal, non-causal or mixed networks Network reconstruction methods have become ubiquitous to analyze large-scale information-rich data from the latest genomic technologies. Recently, methodological advances in the field have been seeking to learn causal relationships using time series or controlled perturbation experiments. However, such strategies can be technically impracticable or costly, if not unethical, in many biological and medical contexts. We have developed a novel network learning method, MIIC, combining constraint-based and information-theoretic frameworks to reconstruct causal, non-causal or mixed networks from non-perturbative data, without the need for an a priori choice on the class of reconstructed network (Verny et al. 2017). The approach has been applied on a broad range of biological datasets from single cell expression data, gene alterations in tumors to protein contact maps (see below) and is freely accessible at MIIC online, an open-access server for network reconstruction (Sella et al. 2018) The signature of causality in observational data has long been known to be associated to 'v-structures' between two mutually (or conditionally) independent variables, \({\small X}\) and \({\small Y}\), connected to a third variable \({\small Z}\), Figure 1A. This situation entails the orientations of the v-structure as, \({\small X\rightarrow Z \leftarrow Y}\), because the edges \({\small XZ}\) and \({\small YZ}\) cannot be undirected, nor \({\small Z}\) be a cause of \({\small X}\) or \({\small Y}\), as these alternative graphical models imply correlations that would contradict independence between \({\small X}\) and \({\small Y}\). | ||
|
|
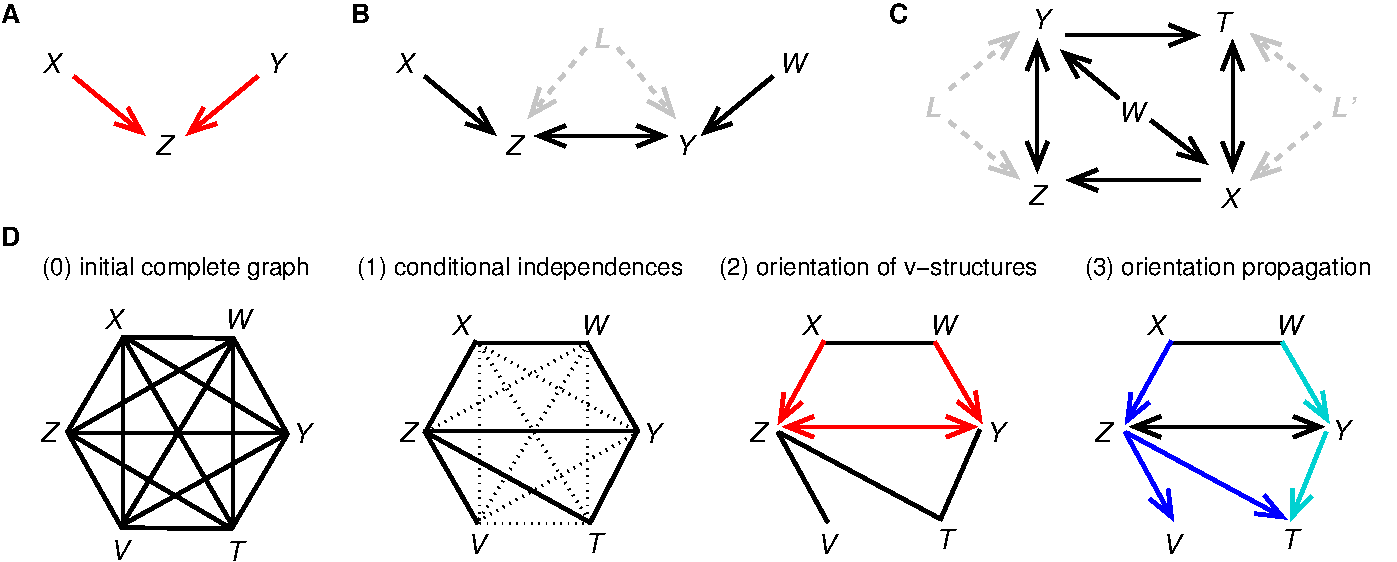
Figure 1. Learning causal networks with latent variables. (A) A v-structure. (B & C) Bidirected edges in 'ancestral graphs' indicate the presence of latent variable(s), \({\small L}\) or \({\small L^\prime}\), corresponding to common cause(s) unobserved in the dataset. (D) Outline of the successive algorithmic steps of constraint-based approaches (Verny et al. 2017). MIIC network predictions belong to the broad class of "ancestral graphs" (Figure 1) that include undirected (—), directed (\({\small \rightarrow}\)) and possibly bidirected (\({\small \longleftrightarrow}\)) edges originating from latent common causes, \({\small L}\), unobserved in the available data (i.e. \({\small \dashleftarrow L \dashrightarrow}\)), Figure 1B-C. These unobserved variables, which can be seen as hidden confounders, are usually present in many real applications and cannot be ignored in practice, as they actually impact the causal relationships between observed variables, as illustrated in Figure 1B-C. MIIC algorithmic steps are sketched on Figure 1D. Starting from a fully connected graph, MIIC iteratively removes dispensable edges, by uncovering significant information contributions from indirect paths based on the "3off2" scheme (Affeldt et al. 2015 & 2016). This amounts to progressively uncover the best supported conditional independencies (i.e. \({\small I(X;Y|\{A_i\})=0}\) implying no \({\small XY}\) link in the underlying network) by iteratively "taking off" the most significant indirect contributions of positive conditional 3-point information, \({\small I(X;Y;A_k|\{A_i\}_{k-1}) > 0}\), from every 2-point (mutual) information, \({\small I(X;Y)}\), as, \begin{equation} {\small I(X;Y|\{A_i\}_n) = I(X;Y) - I(X;Y;A_1) - I(X;Y;A_2|A_1) - ... - I(X;Y;A_n|\{A_i\}_{n-1})} \end{equation}This information-theoretic approach also provides an edge-specific confidence assessment of retained edges, which can be filtered accordingly. Finally, MIIC orients the remaining edges, based on the signature of causality in observational data, which consists in orienting open triples as v-structures, \({\small X\rightarrow Z \leftarrow Y}\), for negative conditional 3-point information, i.e. \({\small I(X;Y;Z|\{A_i\}_n)<0}\) with \({\small I(X;Y|\{A_i\}_n) = 0}\) (Affeldt et al. 2015 & 2016). MIIC outperforms traditional search-and-score and constraint-based methods on a broad range of benchmark networks (Verny et al. 2017, Affeldt et al. 2015 & 2016). It also achieves significantly better results with much fewer samples, Figure 2A, and is typically ten to hundred times faster than earlier methods taking into account the causal effects of unobserved latent variables, Figure 2B (Verny et al. 2017). | ||
|
|
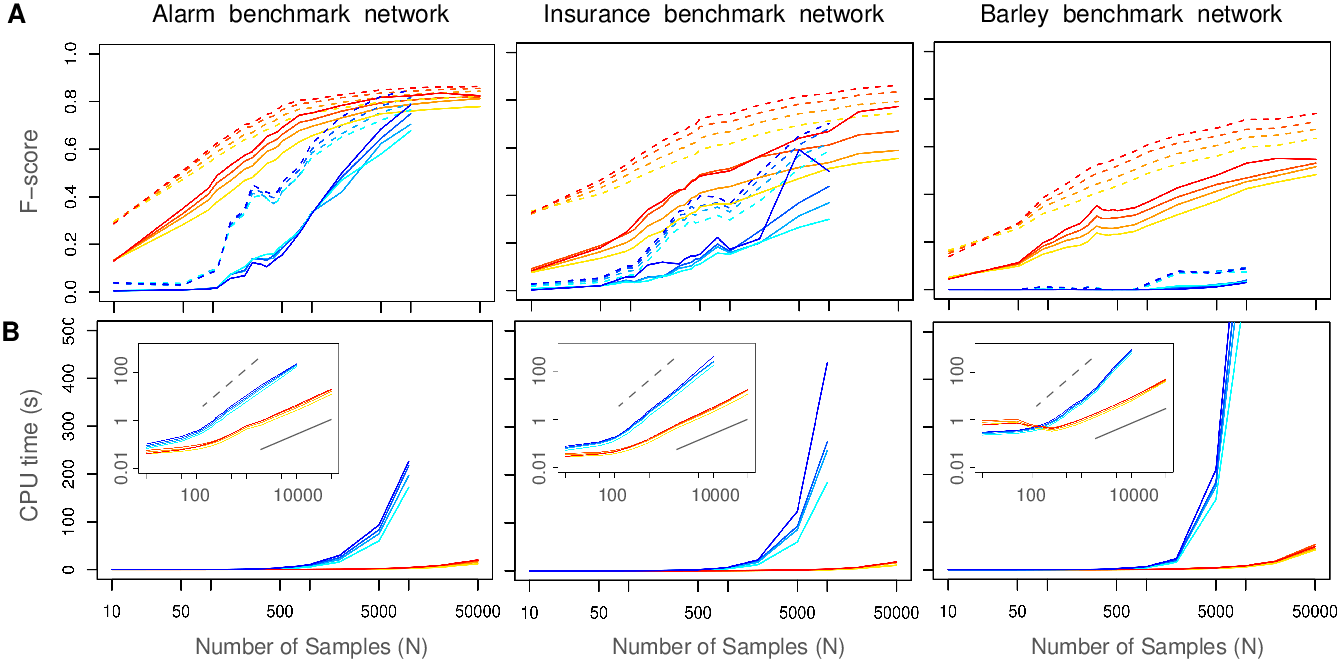
Figure 2. MIIC performance on benchmark networks. (A) F-score (harmonic mean of Precision and Recall) of miic algorithm (warm colors) for 0%, 5%, 10% and 20% of latent variables (top to bottom curves), compared to the RFCI algorithm (cold colors) on benchmark networks of increasing complexity disregarding (dashed lines) or including (solid lines) edge orientations: Alarm [37 nodes, avg. deg. 2.5, 509 parameters], Insurance [27 nodes, avg. deg. 3.9, 984 parameters] and Barley [48 nodes, avg. deg. 3.5, 114,005 parameters]. (B) Computation times of miic (warm colors) compared to RFCI (cold colors). Inserts: computation times in log scale showing a linear scaling (solid bar) for miic and a close to quadratic scaling (dashed bar) for RFCI in the limit of large datasets (Verny et al. 2017). MIIC network reconstructions have been used on a broad range of biological data from single-cell transcriptomics and protein sequence evolution (see below), to the consequences of whole genome duplication in tumor development as well as long-term evolution and disease susceptibility of vertebrates. Figure 3 shows an example of intrinsically causal network. It concerns the reconstruction of a regulatory network from single cell expression data at the time of endothelial and hematopoietic differentiations from the primitive streak cells of the mouse early embryo. The dataset, from Moignard et al. Nat Biotech 2015, includes the expression of 33 transcription factors (TFs), measured by RT qPCR, in 3,934 single cells extracted at 4 different times of the mouse embryo development (days E7.0, E7.5, E7.75 and E8.25). |
||
|
|
Figure 3. MIIC network reconstruction from single cell expression data. (A) Hematopoietic / endothelial differentiation in single cells from mouse embryos. (B) Principal component analysis and (C) K-means clustering of gene expression data with histograms showing the relative proportions of cell populations at each data point (E7.0 to E8.25). (D) Hematopoietic / endothelial differentiation regulatory network between hematopoietic specific (red), endothelial (violet), common (blue) and unclassified (gray) TFs predicted using MIIC (blue edges correspond to repressions), Verny et al. 2017. |
||
|
|
|||
|
|
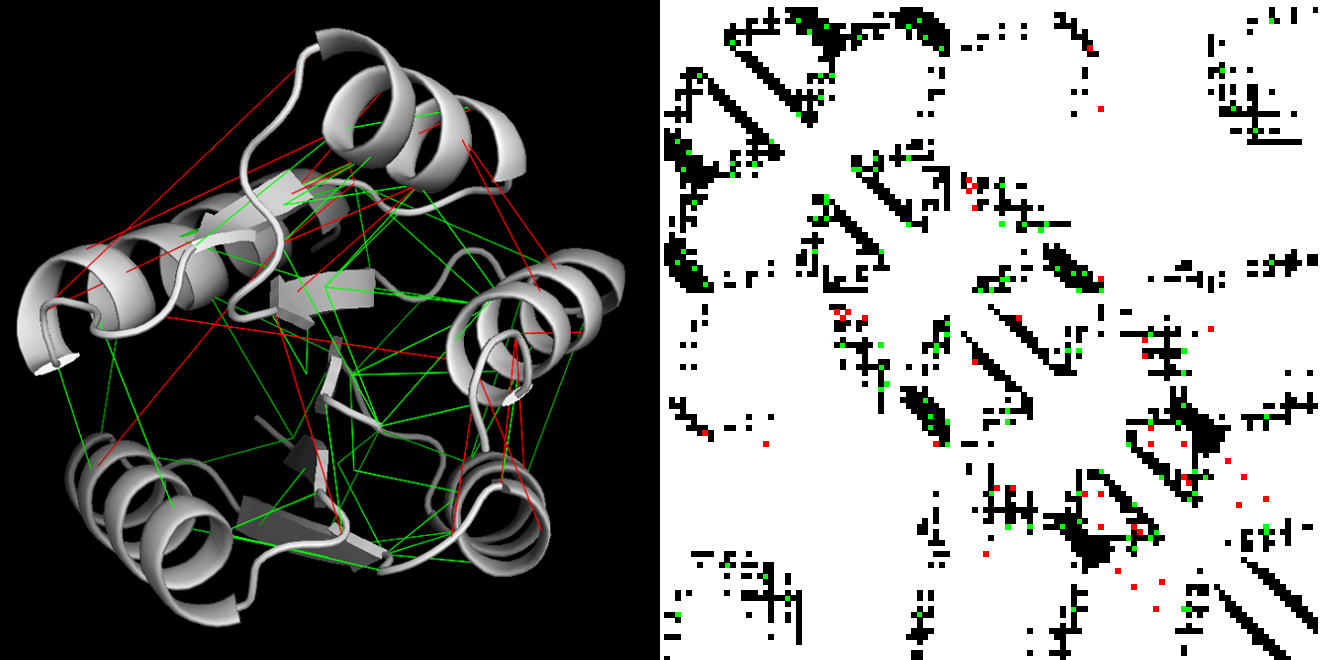
Figure 4. MIIC protein interaction map from amino acid homologous sequences. MIIC residue-residue contact predictions of the response regulator receiver domain (PF00072) mapped on an experimentally resolved structure (1nxs PDB). Contacts are defined as residues with a proximity of less than 8A. Left panel: protein 3D structure with correct predictions in green and apparent errors in red. Right panel: 2D contact map with experimental contacts in black and predictions with same color code as in the left panel (Sella et al. 2018). |
||
|
|
|||
|
|
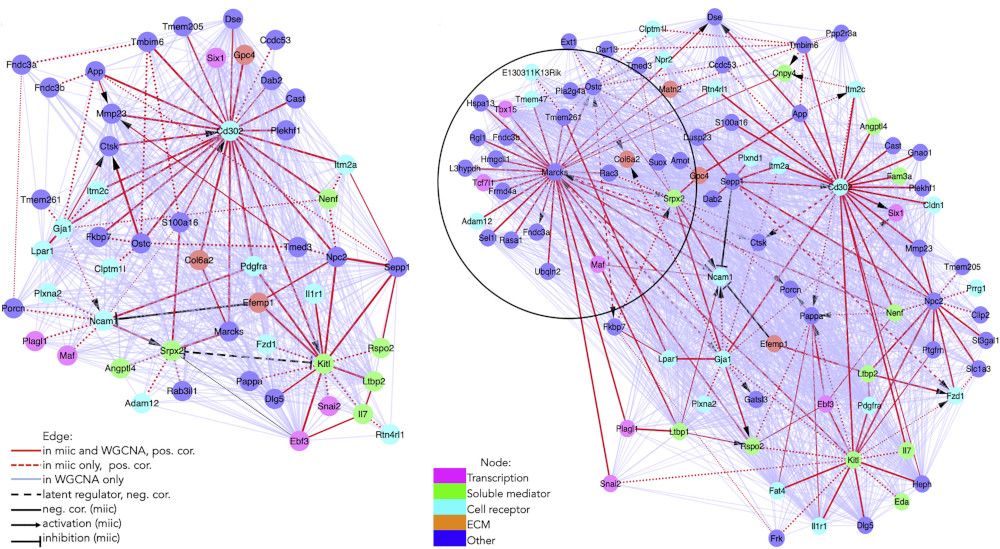
Figure 5. MIIC inferred regulatory networks in bone marrow hematopoietic stem cell-supporting stromal niche population. Gene regulatory networks of Leptin receptor-positive cell population at baseline (left, 1,712 cells) and under stress (right, 3,467 cells), uncovering several novel regulatory hubs around genes Kilt and Cd302 as well as around Marcks under stress conditions (Desterke et al. 2020). MIIC regulatory networks in red hightlight direct regulations between genes by contrast to WGCNA networks displaying both direct and indirect interactions based on gene-gene correlations (scRNAseq data from Tikhonova et al. Nature 2019). |
||
|
|
|||
|
|
|||
|
Related Publications |
Cabeli V, Verny L, Sella N, Uguzzoni U, Verny M, Isambert H: Learning clinical networks from medical records based on information estimates in mixed-type data
|